Query Monitor: How to Debug Performance & Hooks in WordPress
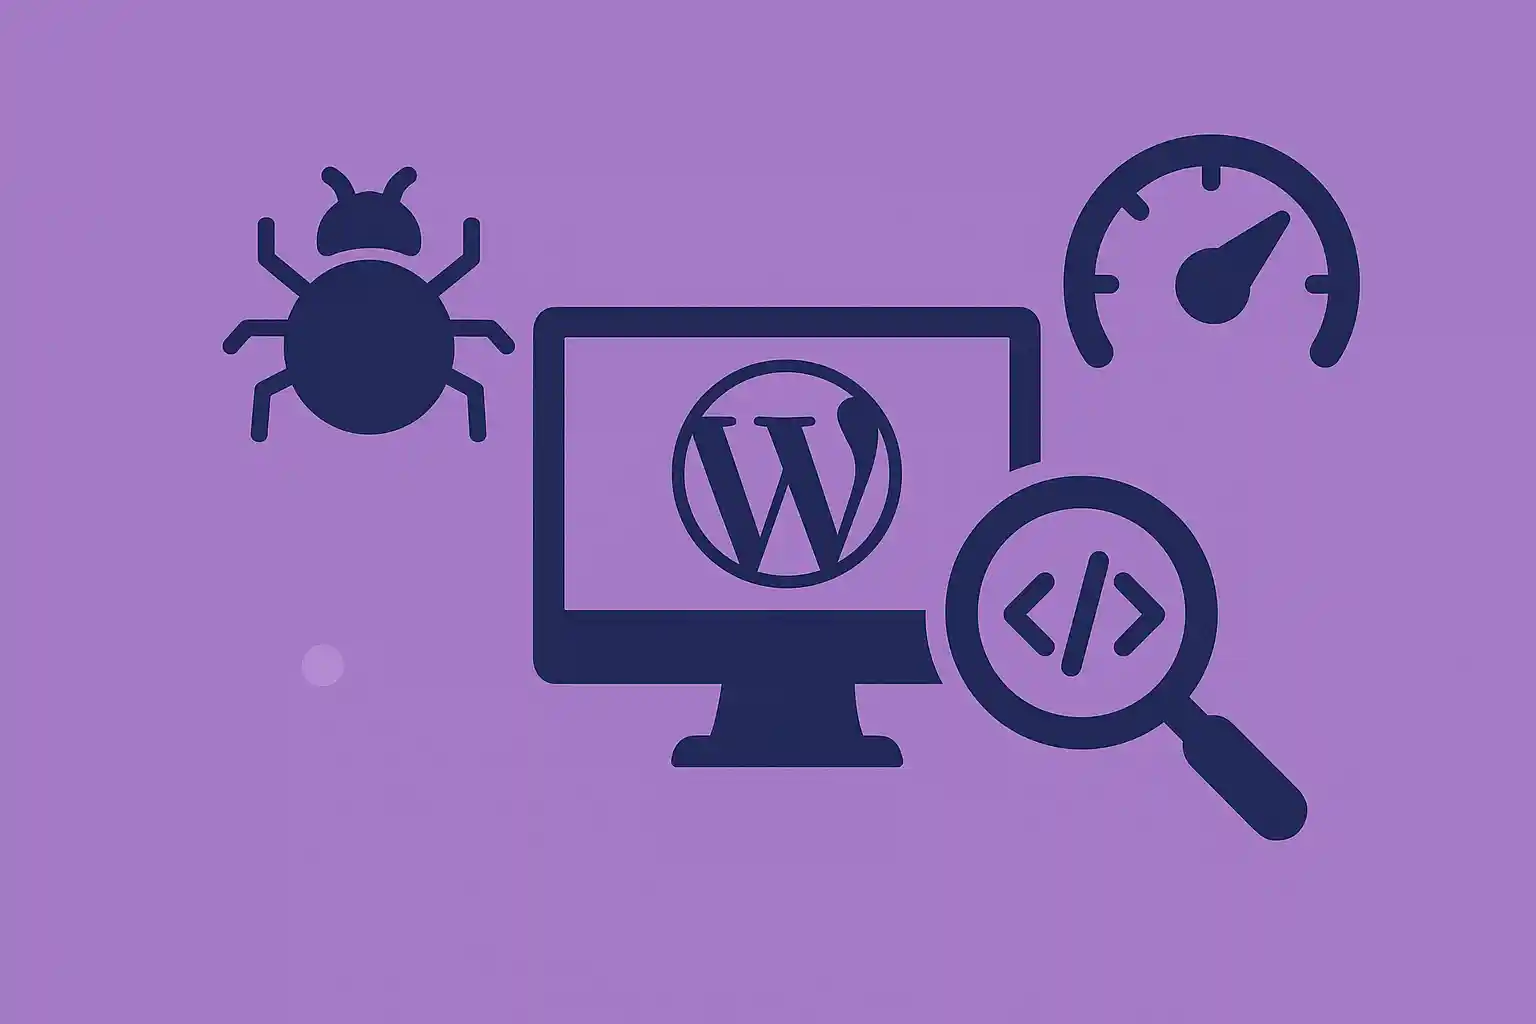
Query Monitor is the developer tools panel for WordPress. It gives you instant visibility into database queries, PHP errors, hooks and actions, HTTP calls, scripts, and more — directly from the admin bar. Think of it as browser DevTools, but specifically for WordPress and WooCommerce.:contentReference[oaicite:0]{index=0}
In this guide, you’ll learn how to install Query Monitor and use it to debug performance issues and hooks/actions on your site without guesswork.
1. Install & Activate Query Monitor
- Go to Plugins → Add New in your WordPress dashboard.
- Search for “Query Monitor” by John Blackbourn.
- Click Install Now → Activate.
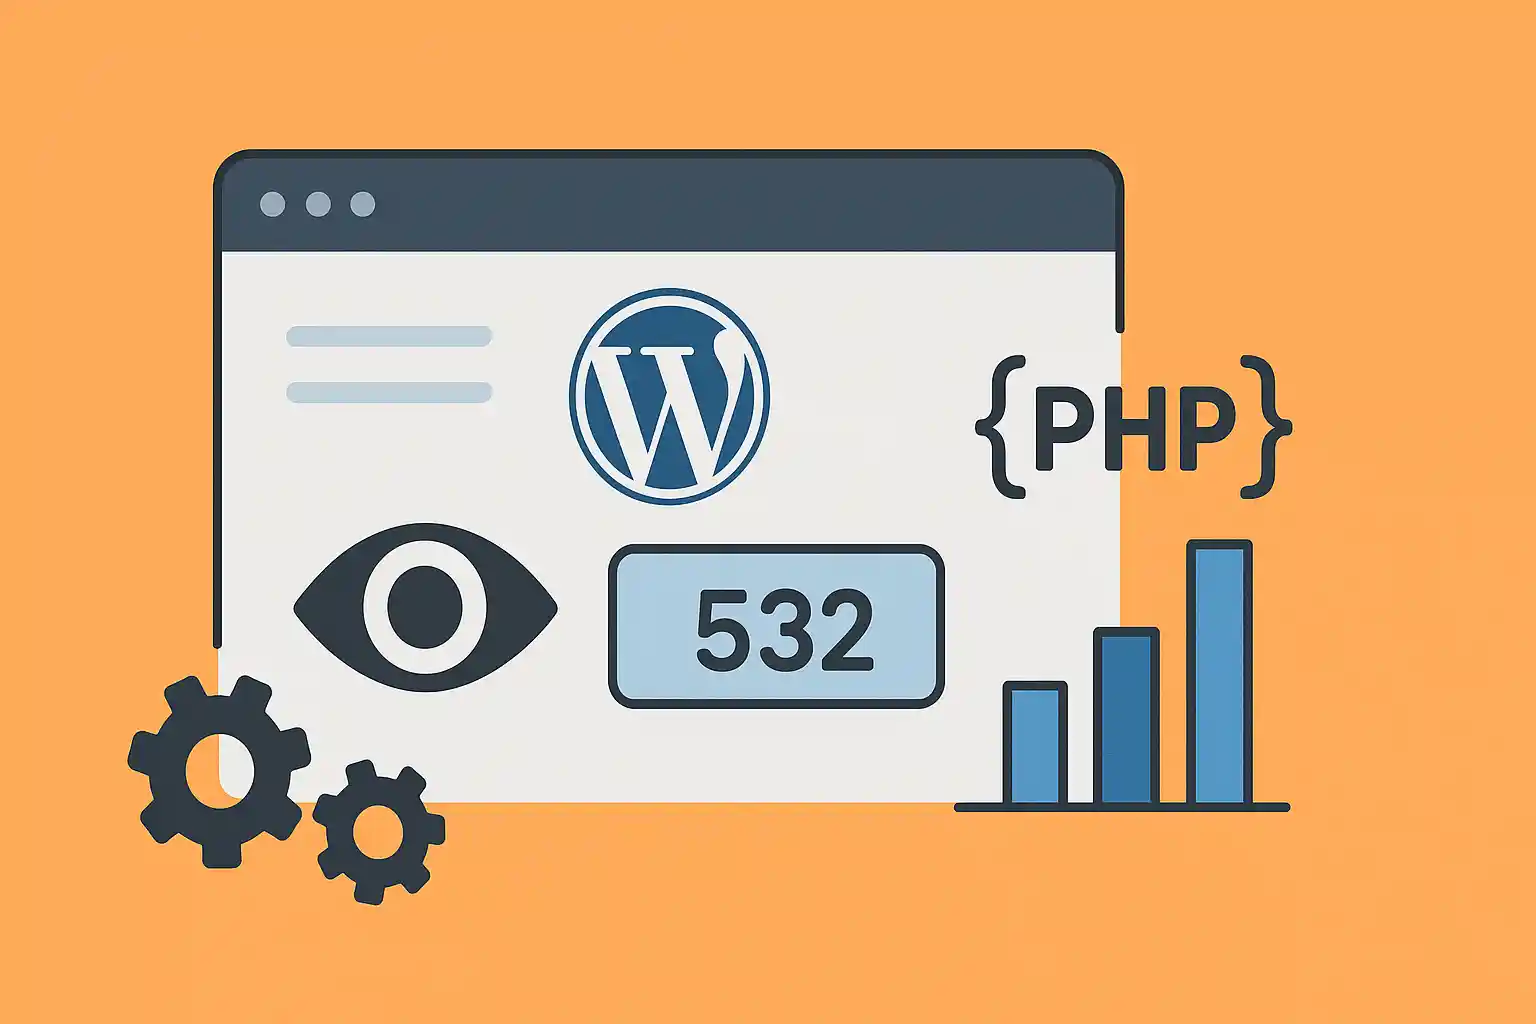
Once active, you’ll see a new item in the admin toolbar showing page generation time, memory usage, total SQL time, and query count. Clicking it opens the main Query Monitor panel for the current page.:contentReference[oaicite:1]{index=1}
Tip: Query Monitor is meant for development and debugging. Keep it on staging, or only enable it briefly on production while you investigate issues.:contentReference[oaicite:2]{index=2}
2. Understand the Admin Bar Summary
On every page (front-end and back-end), the admin bar item shows four key metrics::contentReference[oaicite:3]{index=3}
- Page generation time (seconds)
- Peak memory usage
- Total SQL query time (seconds)
- Total number of SQL queries
If you see unusually high times or query counts, that page is a good candidate for deeper debugging.
3. Debug Slow Pages with the Queries Panel
The Queries panel is your starting point for performance debugging.
3.1 Queries by Component (Find Slow Plugins/Themes)
Open the Query Monitor panel and go to Queries → Queries by Component. Here you’ll see:
- Total query count per component (plugin, theme, core)
- Total query time per component
Look for components with:
- Very high query count
- Unusually high total query time
This quickly reveals which plugin or theme is responsible for database bottlenecks.:contentReference[oaicite:4]{index=4}
3.2 Queries by Calling Function (Pinpoint Problem Code)
Next, check Queries → Queries by Caller to see which functions are generating slow or repeated queries.
For each heavy function you find, you can then:
- Review your custom code or child theme
- Open a support ticket with the plugin author
- Add caching or refactor queries
4. Check PHP Errors & Warnings
The PHP Errors panel appears only if something on the current request triggered a notice, warning, or fatal error.:contentReference[oaicite:5]{index=5}
- Red/orange highlight in the toolbar = errors occurred
- Each error lists the file, line number, and component responsible
Use this to quickly spot:
- Deprecated function usage
- Undefined indexes/variables
- Fatal errors happening only under certain conditions
5. Debug Hooks & Actions
One of Query Monitor’s superpowers is the Hooks & Actions panel. It lets you see which hooks fired on the current request, in what order, and which callbacks are attached.:contentReference[oaicite:6]{index=6}
5.1 View All Fired Actions
Open the Hooks (or Actions) panel to see:
- Which actions ran during the request (e.g.
init,template_redirect,wp_head) - The callbacks attached to each hook
- The component (plugin/theme/core) that registered the callback
This is extremely helpful when you’re asking:
- “Why is my filter not running?”
- “Which plugin is modifying this behavior?”
- “In what order are these hooks firing?”
5.2 Filter Hooks by Component
You can filter the hooks/actions panel by:
- Core (WordPress itself)
- Plugins (individual plugins)
- Theme
Use this when you suspect “some plugin” is interfering with a hook but don’t know which one. Query Monitor will show you the exact callback name and file, so you can jump straight into the code.:contentReference[oaicite:7]{index=7}
6. Inspect Scripts, Styles, and HTTP API Calls
Slow pages are not just about database queries. Query Monitor also helps with:
6.1 Enqueued Scripts & Styles
In the Scripts and Styles panels you can see:
- All enqueued JS and CSS files
- Dependencies and dependents
- Missing or broken dependencies
- Component (plugin/theme) that enqueued each asset
Use this to identify heavy front-end assets that you can dequeue, defer, or conditionally load.:contentReference[oaicite:8]{index=8}
6.2 HTTP API Calls
The HTTP API Calls panel lists all server-side HTTP requests executed during the current request::contentReference[oaicite:9]{index=9}
- Request URL
- Response code
- Time taken
- Component responsible
If a plugin is calling external APIs on every page load, you’ll see it here and can decide whether to cache or limit those calls.
7. Use the Overview Panel for a Quick Health Check
The Overview panel gives a high-level view of the current page::contentReference[oaicite:10]{index=10}
- Page generation time
- Peak memory usage
- Number of database queries
- Number of HTTP API calls
- Object cache status and hit rate
Use it as a quick “health check” to compare pages:
- Is the shop archive heavier than single product pages?
- Does the admin screen you built use too much memory?
- Is object caching enabled and effective?
8. Debugging Custom Hooks with Query Monitor
If you’re writing custom code and need to debug hooks, you can combine Query Monitor with your own logging.
8.1 Add a Debug Callback
Example: see when your custom action runs and what it receives:
add_action( 'myplugin_after_save', function( $post_id, $data ) {
    error_log( 'myplugin_after_save fired for post ' . $post_id );
}, 10, 2 );
Then, in Query Monitor:
- Open the Hooks panel to confirm
myplugin_after_savefired - Use the Logs (if you’re logging via
error_log()and a log viewer plugin) to see the sequence
8.2 Check Priority & Conflicts
Hooks sometimes fire, but another callback overrides your changes. Use the hooks panel to confirm:
- Which callbacks are attached to the same hook
- Their priority order
- Whether a plugin is running after you and undoing your logic
9. Best Practices When Using Query Monitor
- Use it on staging first. Only turn it on in production when needed.
- Focus on a single page at a time. Query Monitor is “per request”, not historical.:contentReference[oaicite:11]{index=11}
- Look for patterns. High query counts + slow HTTP calls + PHP notices often point to the same problematic plugin or function.
- Disable after debugging. Like any profiler, it adds overhead while active.:contentReference[oaicite:12]{index=12}
Conclusion
Query Monitor is one of the most valuable free tools for WordPress developers. It gives you real-time insight into:
- Database queries and their sources
- PHP errors and warnings
- Hooks and actions, including which callbacks run when
- HTTP API calls, scripts, styles, and environment details
By learning how to read the Queries, Hooks, HTTP API, and Overview panels, you can debug performance issues and hook conflicts in minutes instead of hours.
Summary workflow:
Install Query Monitor → Open slow page → Check Overview → Inspect Queries & HTTP calls → Inspect Hooks & PHP errors → Fix or optimize offending plugin/theme/code.
🔌 Looking for more? Check out our WordPress Plugins Hub to discover recommended tools and how to use them.

